Understand your usage
PhoenixAI Anywhere meters the clusters it manages in CCU. CCU measures compute over time: it accrues while a cluster's nodes are running and stops when they are not. It does not count queries run, rows stored, or bytes read — a cluster nobody queries all day still accrues usage, and a cluster doing the same work on half the cores accrues half as much.
How usage is measured
Anywhere reads a running count of CPU seconds from each cluster and converts it:
CCU = 0.9 x coreSeconds / 3600 / 4
Read it as: core-hours are coreSeconds ÷ 3600, and one CCU is 0.9 of a four-core hour. The
console prints this formula, together with the version of it in force, above the metering periods
table — so the number on screen can always be traced back to the arithmetic that produced it.
Two things about that formula are worth stating plainly:
- CPU is its only input. Memory is collected and reported on every record, but it does not affect CCU.
- Daily usage is derived from the change between consecutive records, not from the raw counter.
coreSecondsaccumulates continuously and starts over whenever the counter restarts — after a coordinator restart, for example — so a single record can hold a lower value than the one before it. That is expected; the console counts those resets and reports them on the Audit tab.
Anywhere samples every cluster it serves on a fixed interval, writing one record per cluster per interval into a tamper-evident ledger it keeps itself. The interval is one hour by default.
The usage metric is exposed by PhoenixAI Database 4.1.x-ee and later. A cluster running an older version is reported as not metered, and named, rather than being counted as zero.
View your usage
- Sign in to the PhoenixAI Anywhere console.
- In the left-side navigation pane, choose Usage & Metering.
The page has three tabs. All times on it are UTC, whatever your browser's timezone, so a metered period means the same thing to everyone who reads it.
Overview
Where you stand this month. The headline figures: This month's CCU, Clusters tracked, Collector status, and Last metered at. Below them, Metering periods lists each period with its window, its status and the CCU recorded against it, under the formula in force.
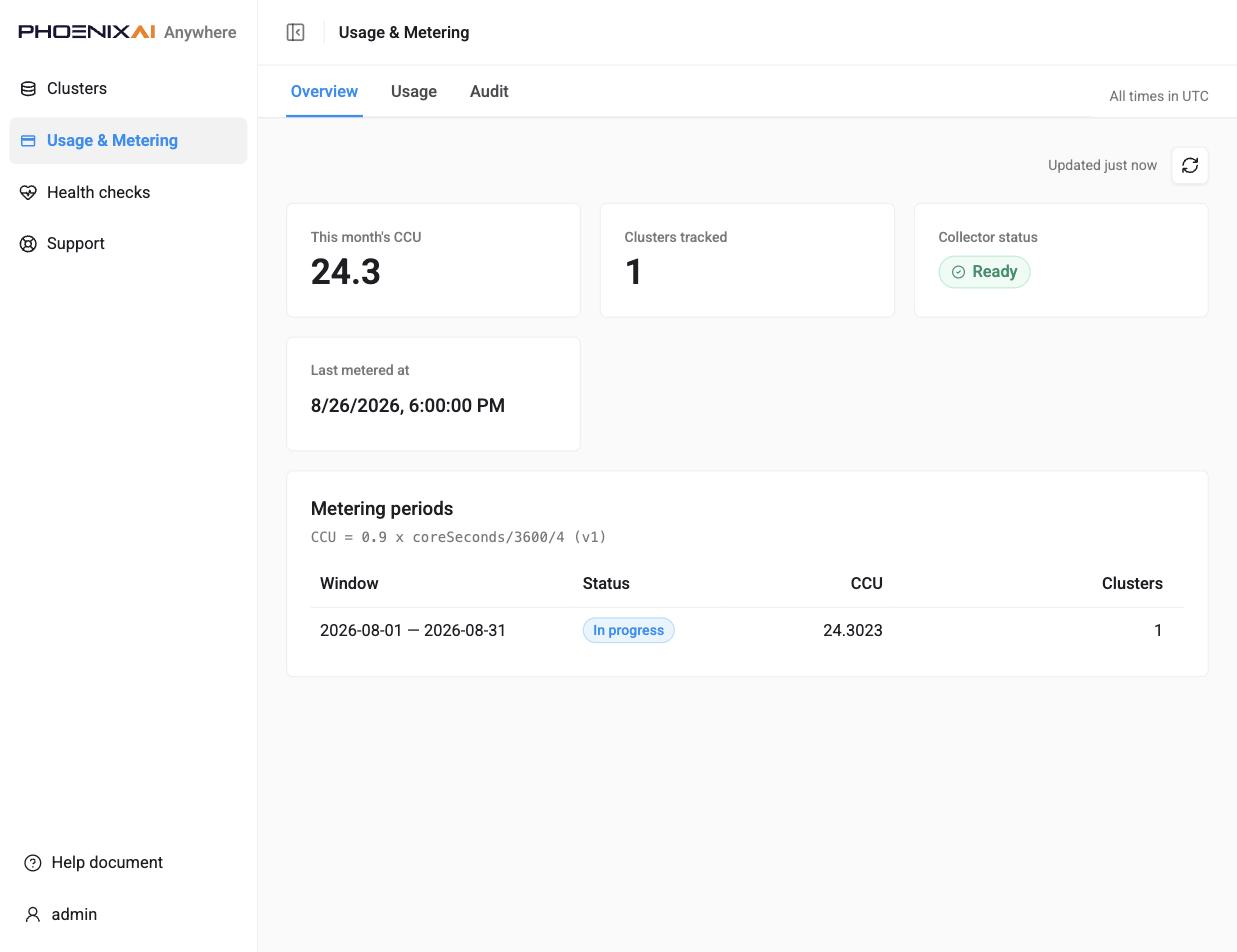
A period that has not closed yet shows as In progress — its CCU is what has accrued so far, not a final figure.
Usage
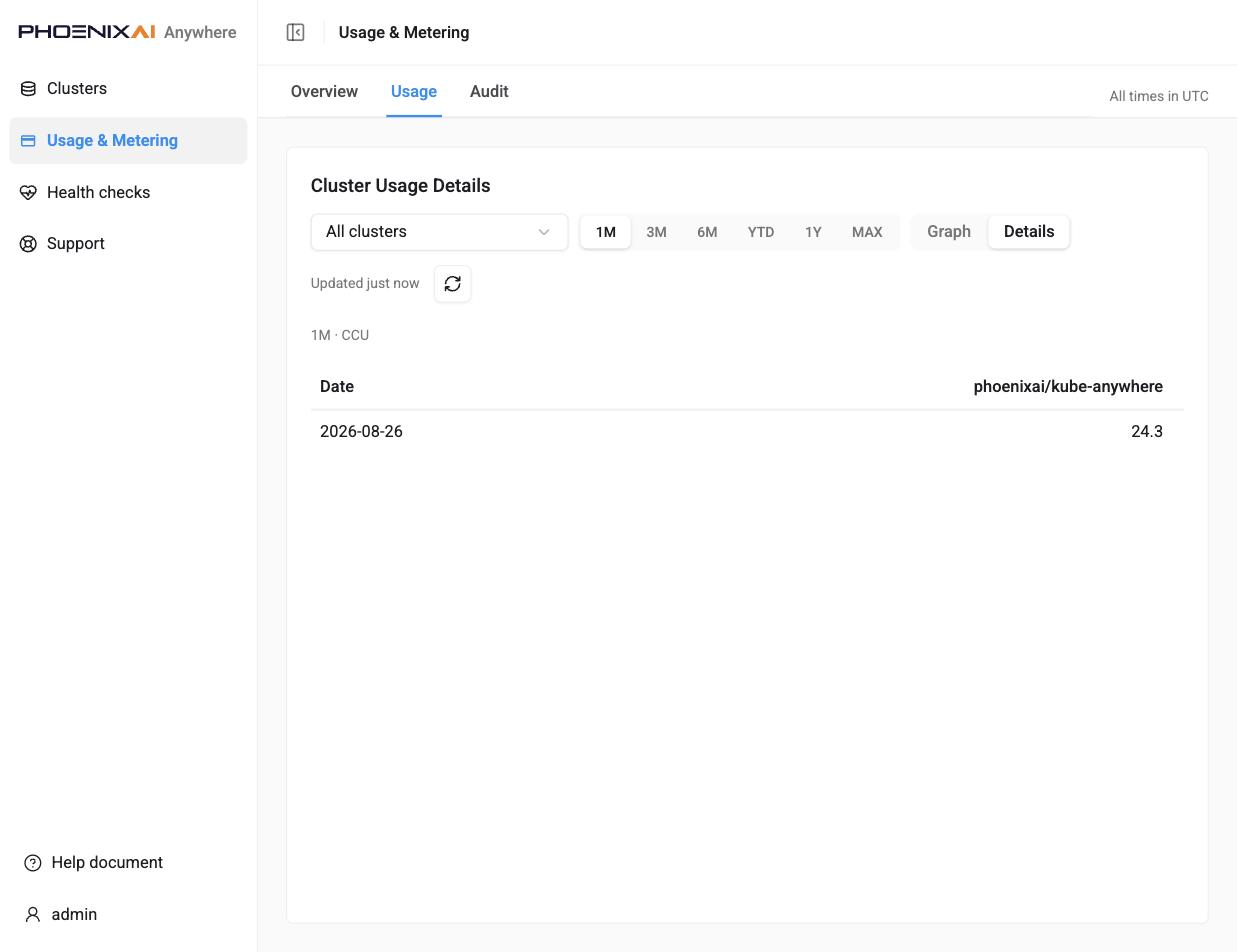
How that total accrued, day by day. Daily CCU per cluster, over a range you choose: 1M, 3M, 6M, YTD, 1Y or MAX. The All clusters list narrows the view to one cluster.
Two views of the same numbers, chosen with the Graph / Details toggle:
- Graph plots daily CCU as a line per cluster, for reading the shape of a month at a glance.
- Details gives the same data as a table — one row per day, one column per cluster — which is what you want when you need the figures rather than the trend.
Audit
The record set behind the numbers — everything the figures were derived from: how many records were collected and over how many clusters, the sampling interval, each cluster's first and last record with its sequence range, and the number of counter resets seen.
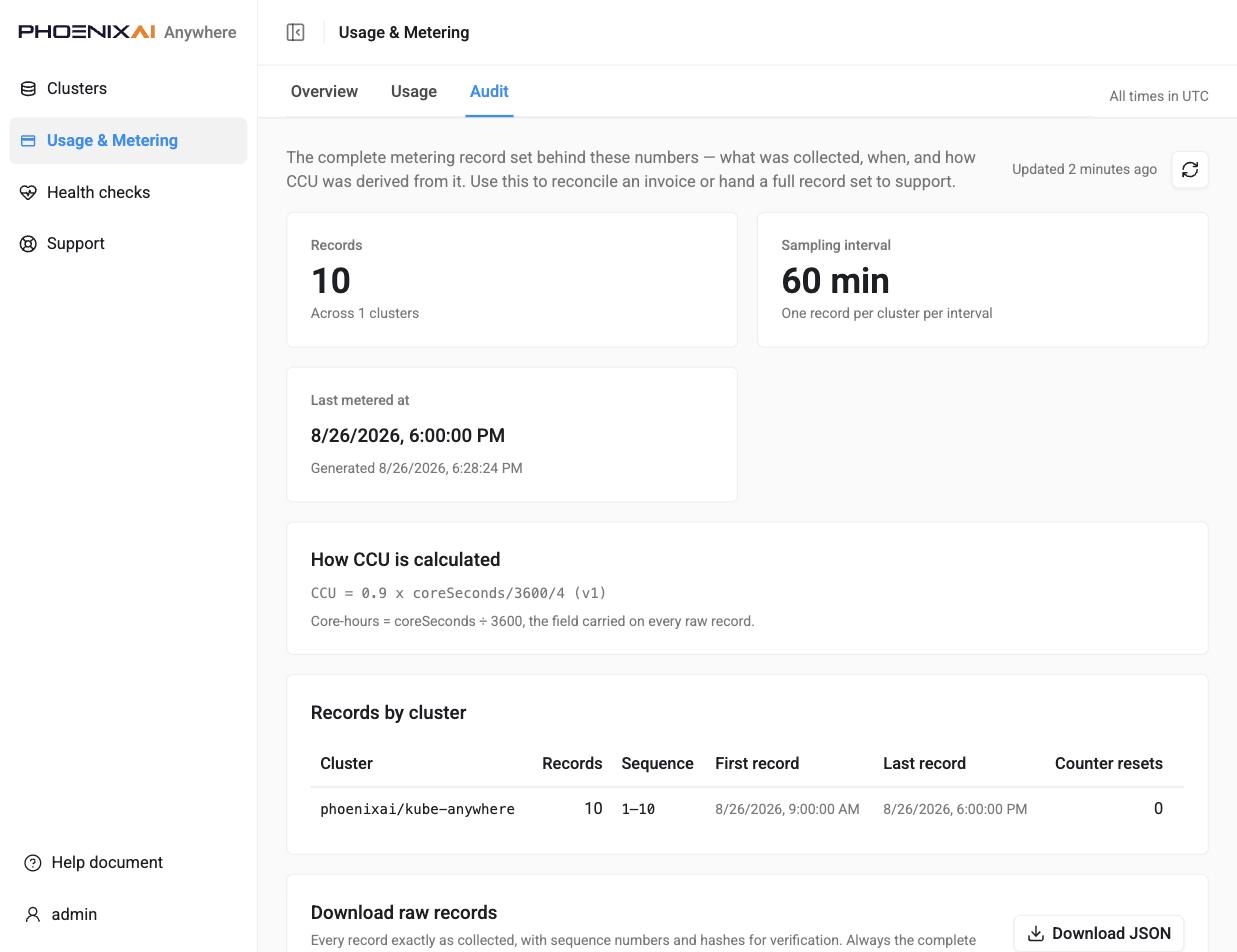
Download JSON exports every raw record, with sequence numbers and hashes, for verification or to
hand to support. It is always the complete set — every cluster, full history — and it is not meant
to be read by eye; for spreadsheet-friendly daily figures use the Usage tab instead. The same
file is available from the API, as GET /api/v1/admin/metering/export with an administrator
session, so exports can be scripted.
Keep each file exactly as downloaded. The records are chained, and editing or reformatting one breaks the chain, so the file would be reported as altered.
The ledger lives on Anywhere's own data volume and is the one thing there that cannot be reconstructed. Exporting on a schedule keeps a copy of your billing history that does not depend on that volume.
Use this tab when a figure needs reconciling rather than just reading.