Anywhere Console pages
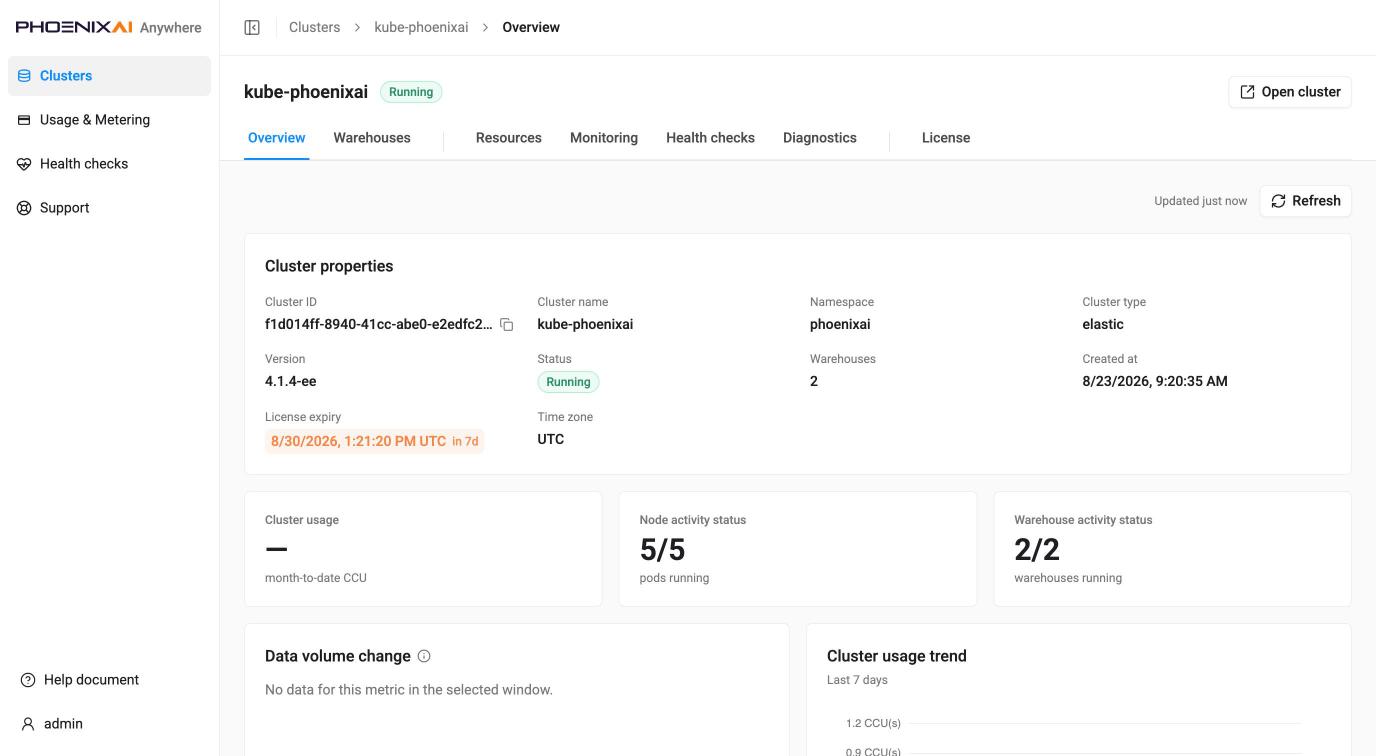
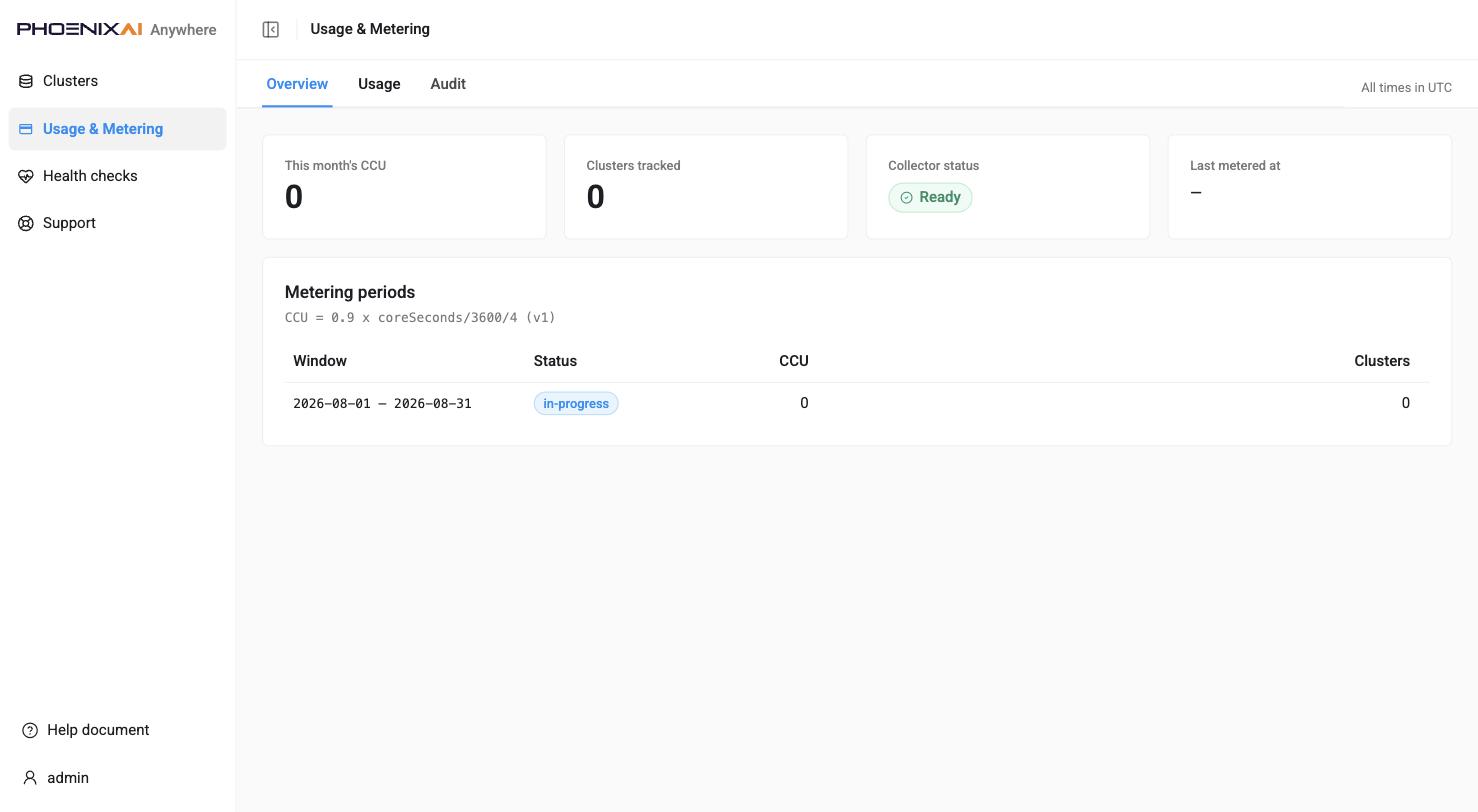
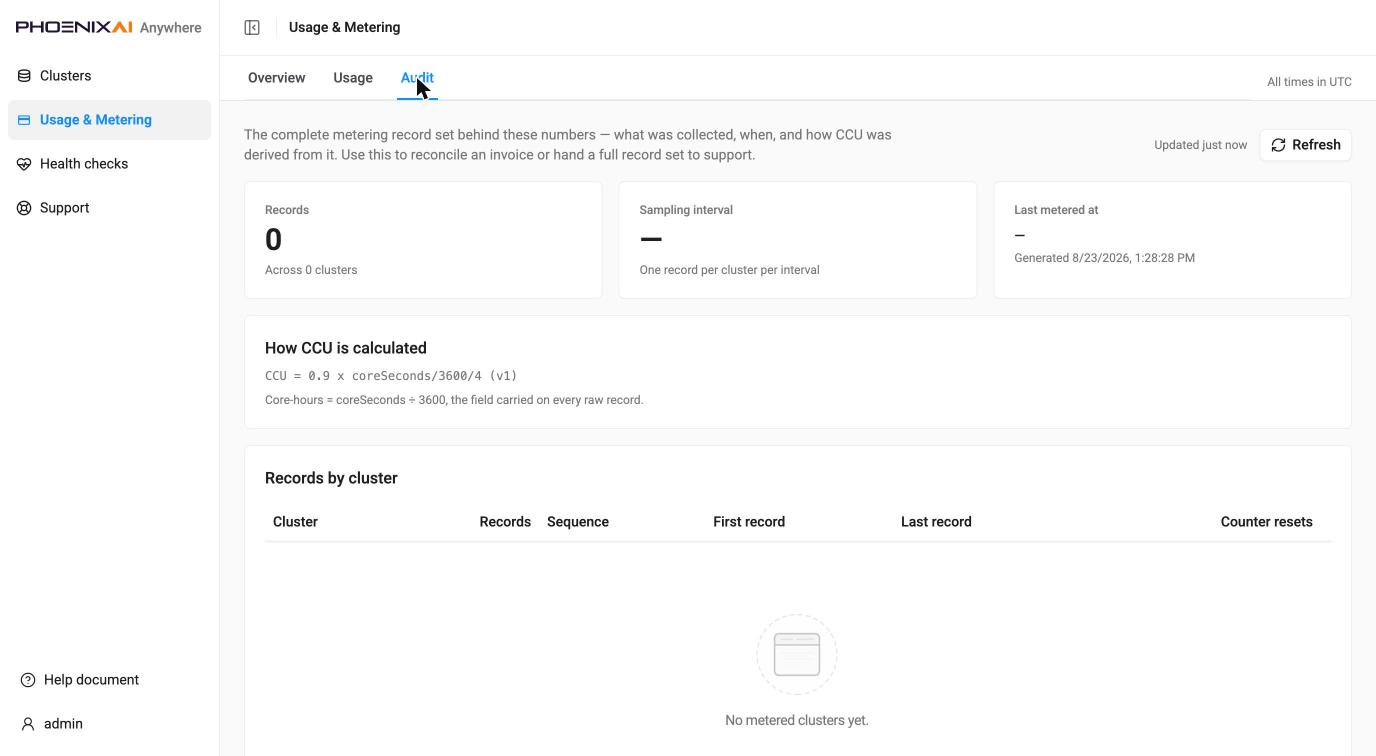
What a brand-new environment looks like. Several pages are empty until time passes or a setting is turned on, and that is normal rather than broken: Usage & Metering reads all zeros (
Clusters tracked 0,Last metered at —) because usage is sampled on an interval; the cluster Overview shows—for month-to-date CCU and "No data for this metric" for data volume, because that comparison needs a 24-hour baseline the cluster is too young to have; Support has no bundles until someone creates one; and Query insights is switched off by default — see Query insights on Cluster Console pages for the two settings it needs.
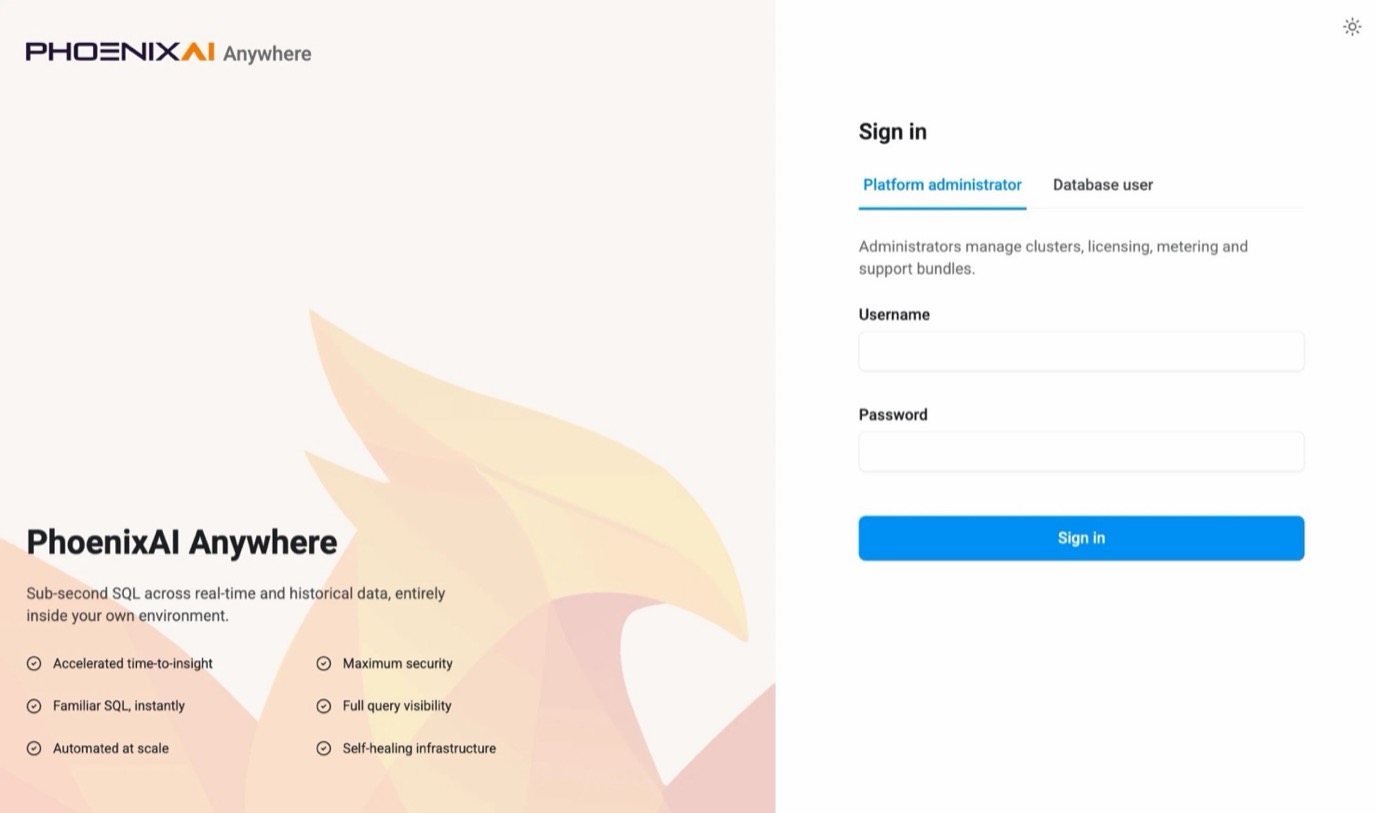
Sign in — /login
The Platform administrator tab of the shared sign-in page, which both consoles use. The path
decides which tab opens, so /login lands here and /cluster-console/login opens the Database user
tab; switching tabs is a click, not a navigation. Username and password go against the admin Secret.
A session-expiry notice appears here when an earlier session timed out, and sign-in returns you to
the page you were trying to reach (carried as ?redirect=). A theme toggle sits in the top-right
corner, and the brand hero panel is shared by both tabs.
Clusters — /clusters
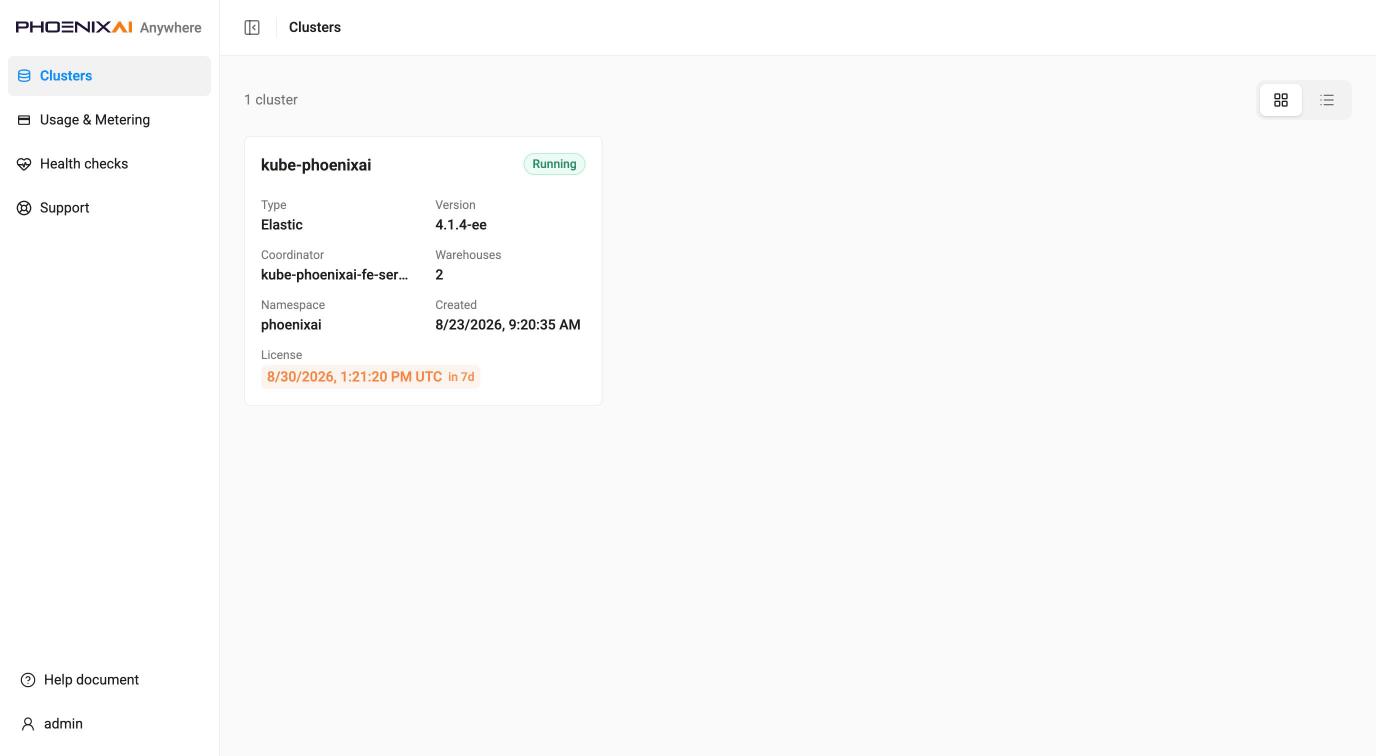
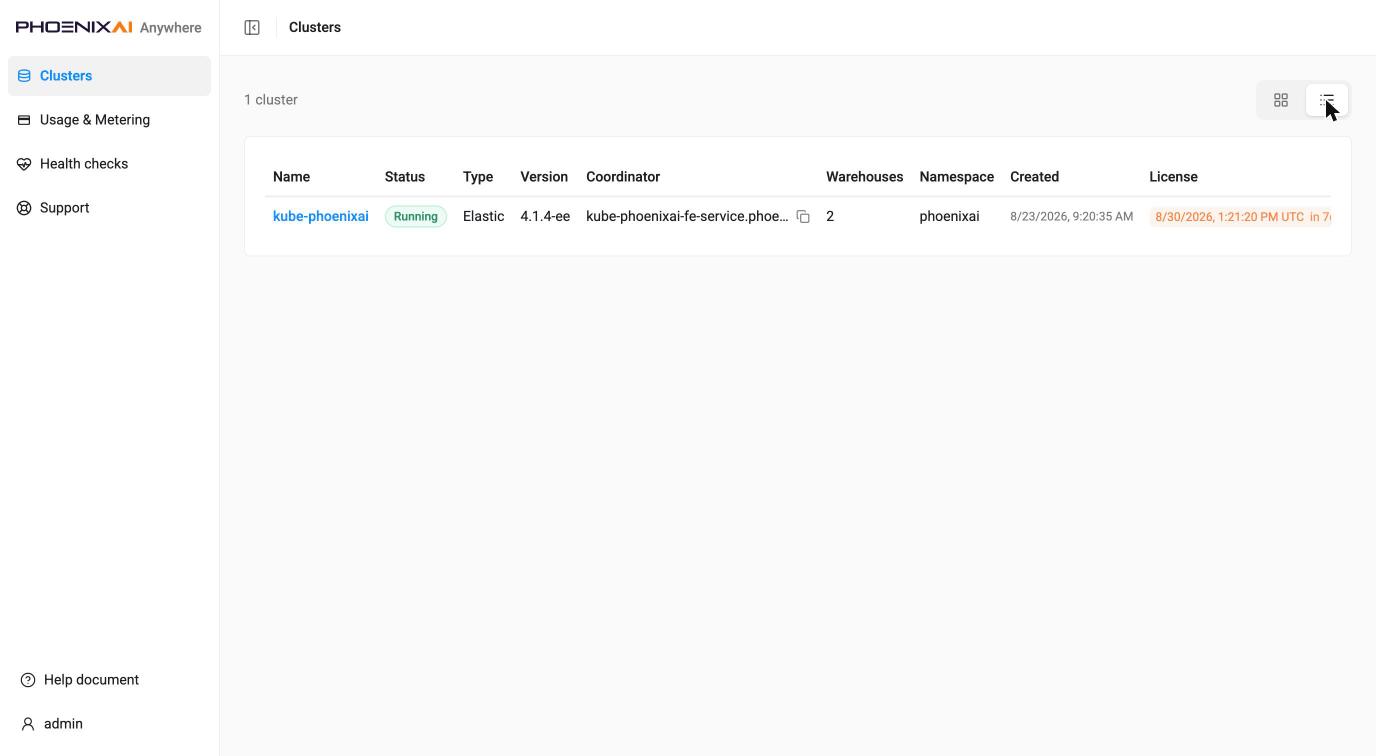
The landing page: every cluster the installation can see, in card view or table view
(?layout=table). Both show name, status (Running / Creating / Stopped / Failed / Unknown), type,
version, coordinator address, warehouse count, namespace, creation time and license expiry — with
a near-expiry license highlighted. Selecting a cluster opens its detail page.
Cluster detail — /clusters/{ns}/{name}
One cluster, as seven tabs addressed by ?tab= so links stay shallow (overview is the default
and carries no parameter). Open cluster in the top-right hands off to the Cluster Console for
this cluster.
Overview — cluster properties (name, namespace, type, version, status, warehouses, created, license expiry, time zone), month-to-date CCU, node and warehouse activity, data-volume change over 24 hours, and a 7-day cluster usage trend, annotated All times in UTC.
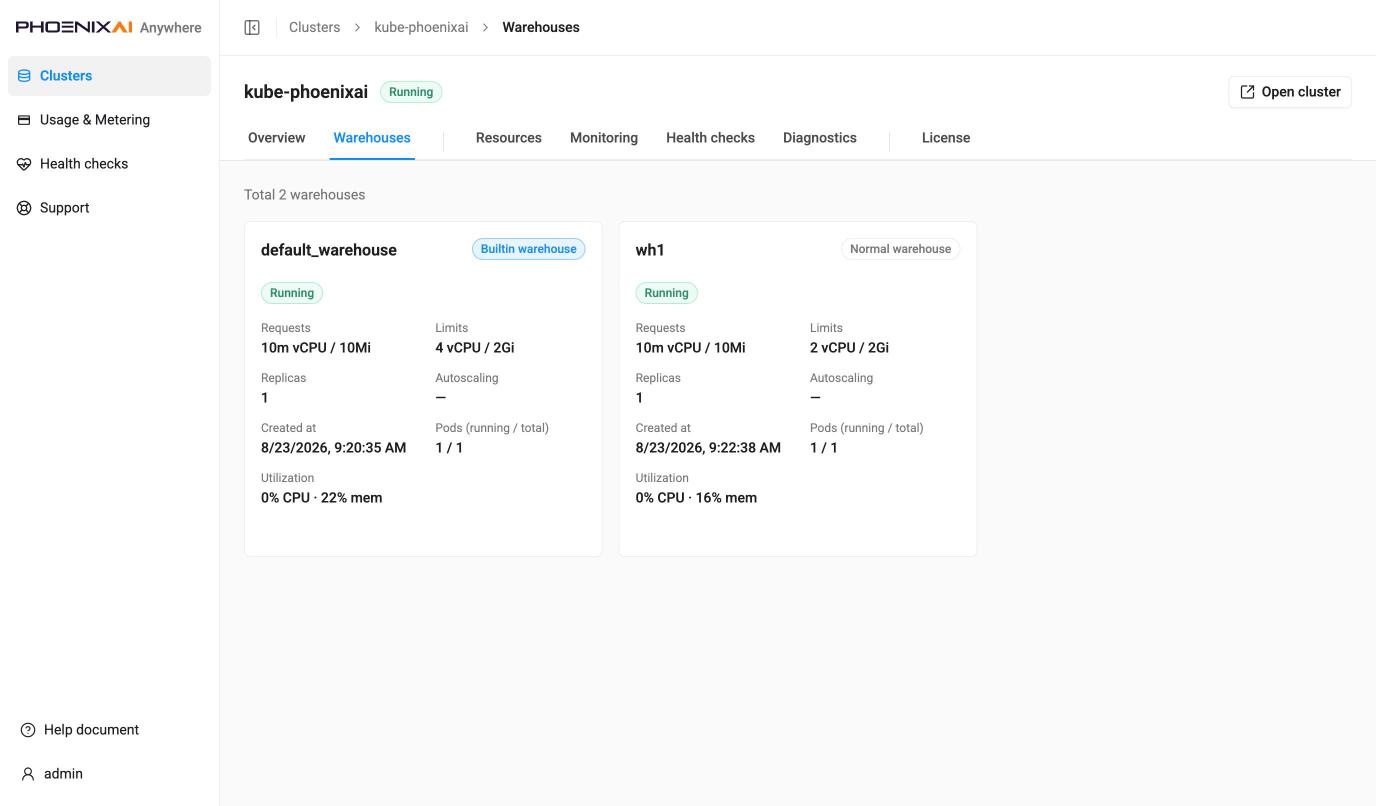
Warehouses — one card per warehouse including the built-in one, badged Builtin warehouse or Normal warehouse, with requests and limits, replicas, autoscaling range, creation time, pods running/total and utilization.
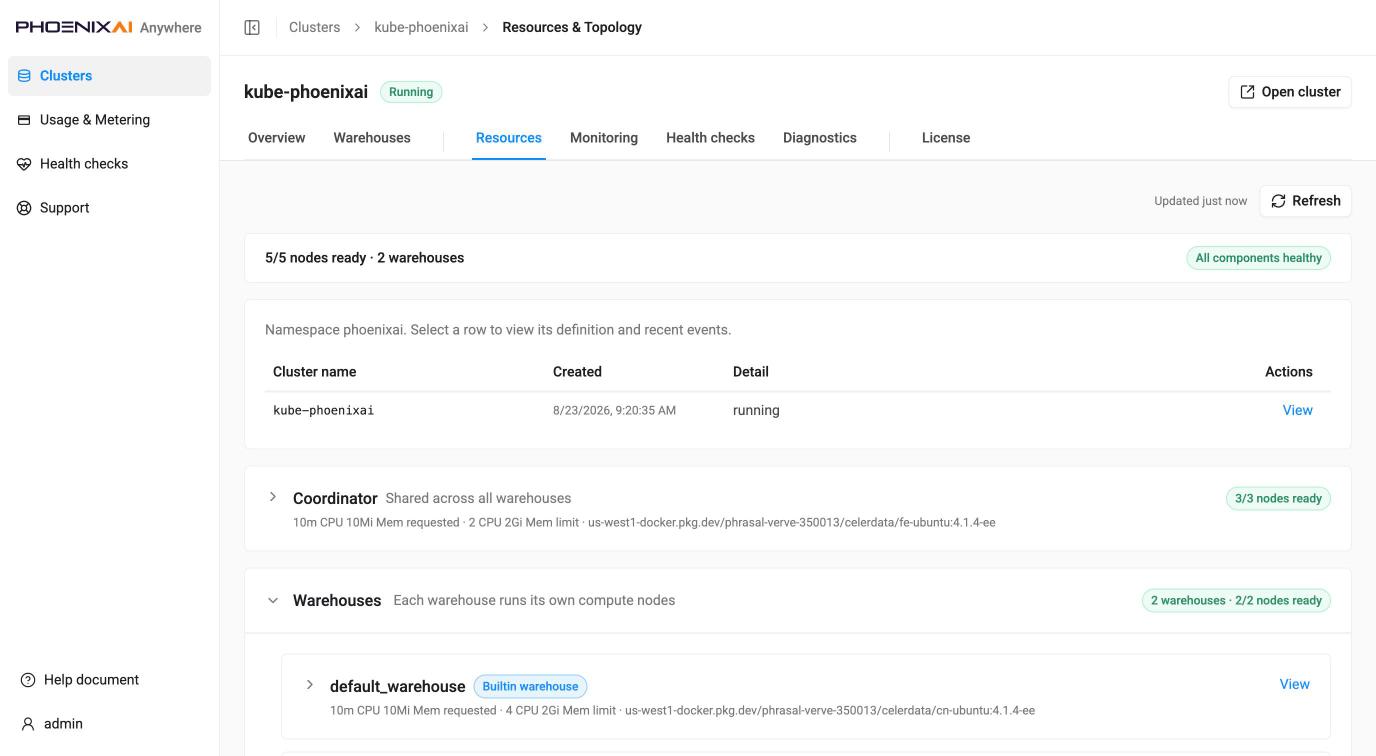
Resources (breadcrumb: Resources & Topology) — a health strip (nodes ready, warehouse count, "All components healthy"), then the cluster object itself and expandable groups: Coordinator (shared across all warehouses) and Warehouses, each warehouse running its own compute nodes, with each group naming its image and its requests and limits. Each row's View shows its manifest and recent Kubernetes events; pods carry live CPU and memory against requests.
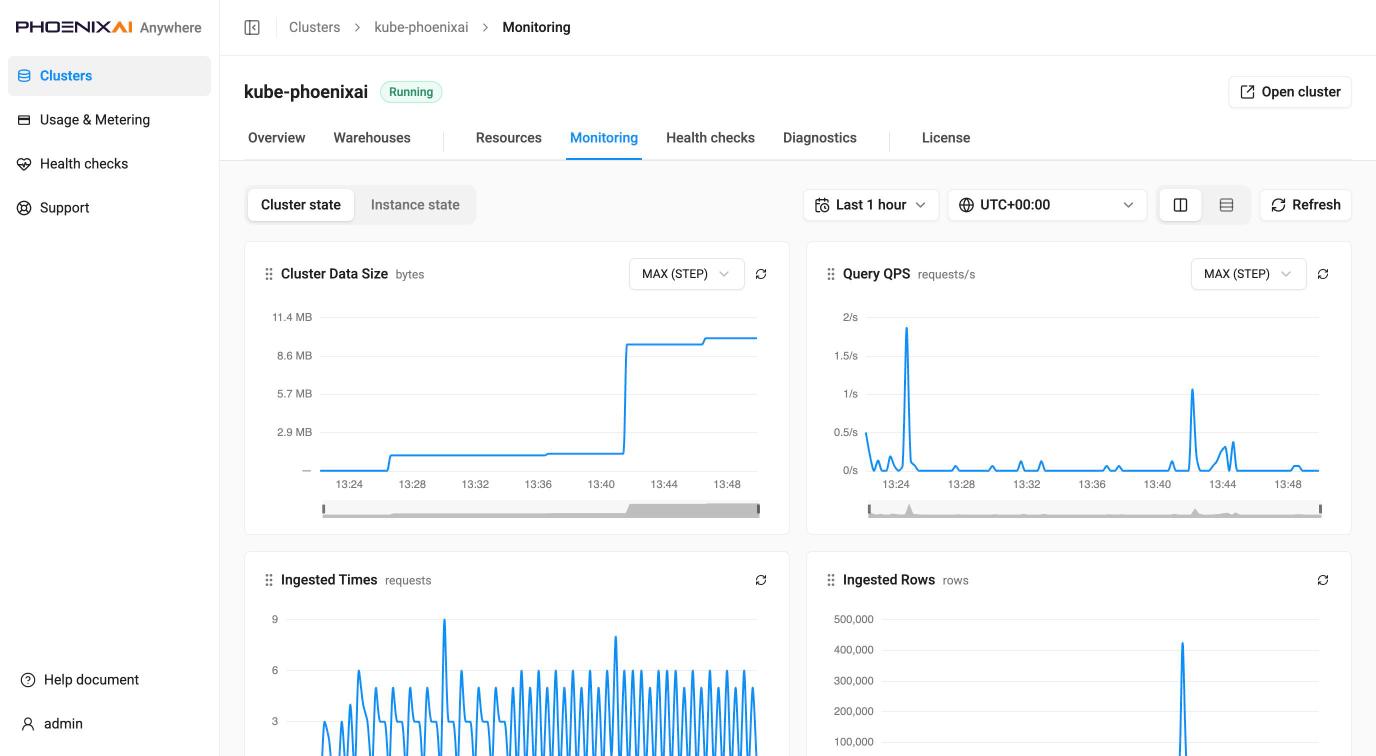
Monitoring — charts over a selectable time range and display timezone, split between Cluster state and Instance state, with a one- or two-charts-per-row layout that can be reordered, and a per-chart aggregation selector. The display timezone defaults to UTC+00:00. Which charts appear, and which aggregation each defaults to, depends on what the cluster's PhoenixAI version exposes — treat any specific set as an example rather than a fixed list; here it is Cluster Data Size, Query QPS, Ingested Times and Ingested Rows. Each chart title carries a tooltip describing what that chart measures. An empty chart means no data in the selected window; if one is empty when you expect data, run the Prometheus dependency check described in Point the Anywhere Console at Prometheus.
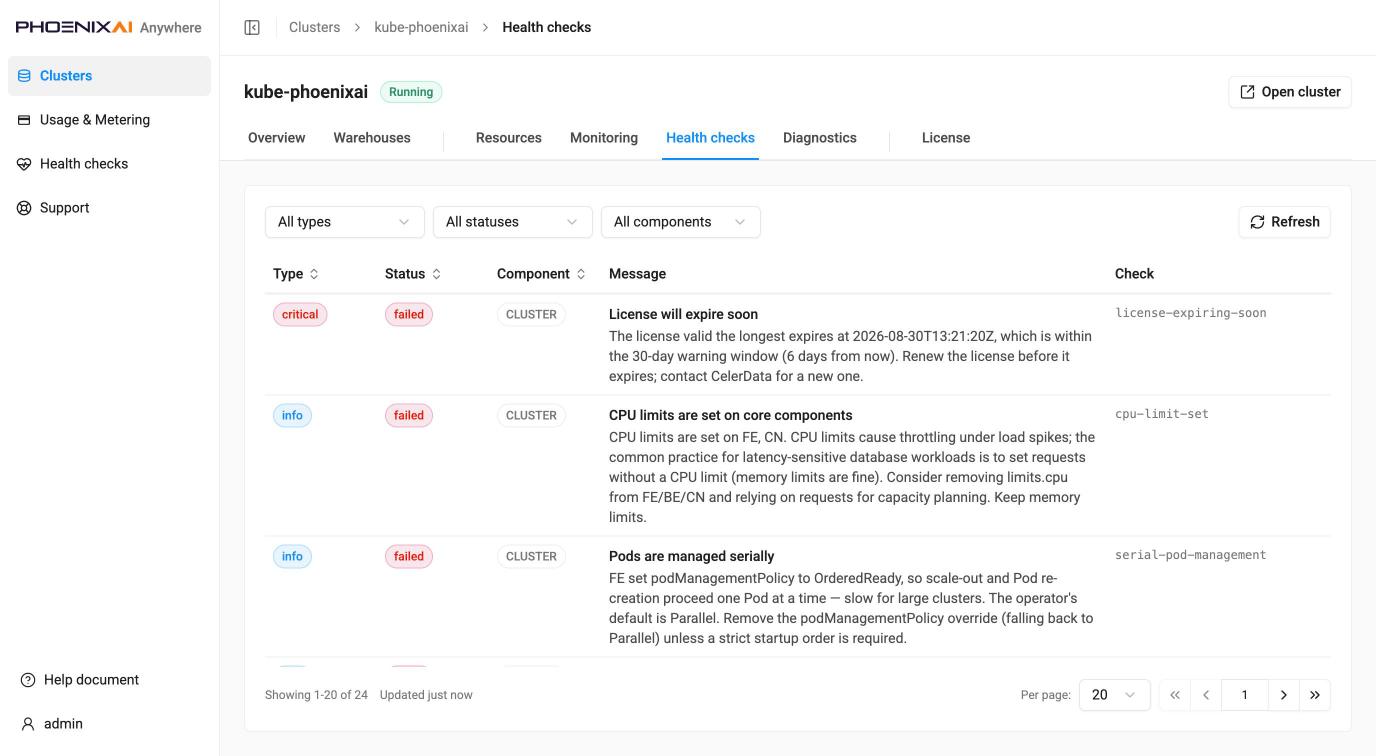
Health checks — this cluster's checks by type (info / warning / critical), status, component and message, each naming the check that produced it, with sortable columns, filters and pagination. A real cluster produces a substantial list — a couple of dozen findings on a newly built cluster — and they are specific and actionable rather than generic: an expiring license, CPU limits set on latency-sensitive components, multi-replica components not spread across topology domains.
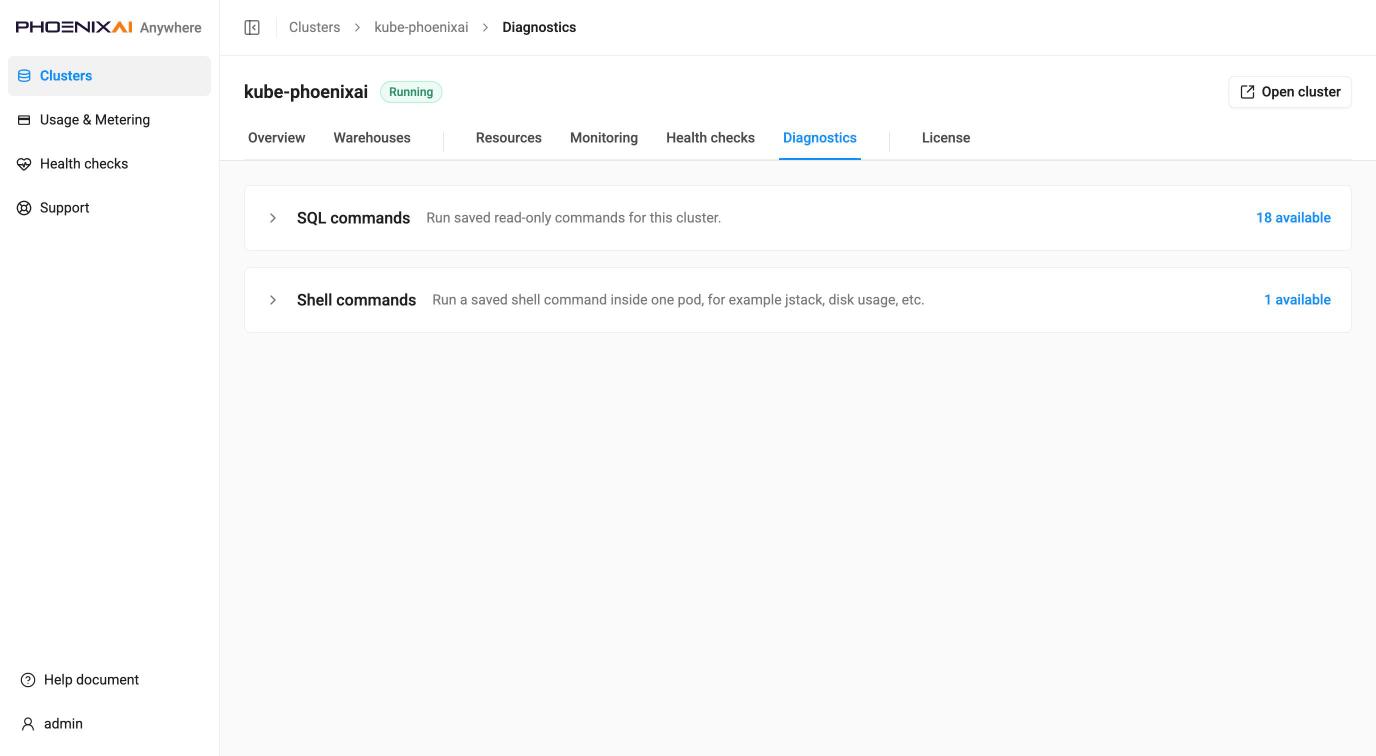
Diagnostics — two collapsed libraries, each reporting how many entries it holds (16 SQL commands and 1 shell command here). SQL commands runs saved read-only commands for this cluster; Shell commands runs a saved shell command inside one pod. Expanding a library reveals its picker, Run, and New command; results report exit code, stdout and stderr. Creating custom shell commands is gated by configuration and can be disabled entirely.
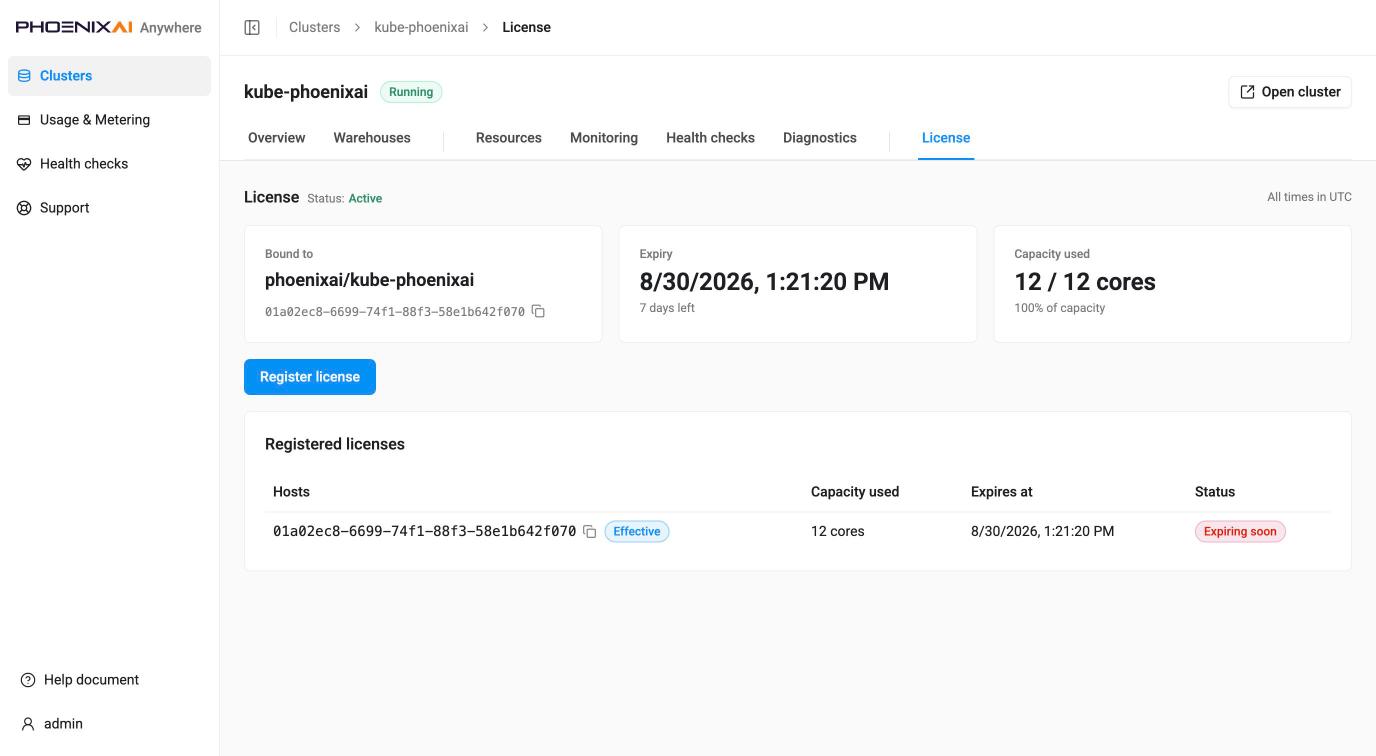
License — the effective license for this cluster: what it is bound to, expiry with days remaining, capacity used against licensed cores, Register license, and the registered-licenses table marking which one is effective. Times are UTC.
A newly created cluster already carries a license — nobody registers one by hand — but it is
short-lived, so a fresh environment shows Expiring soon and Health checks raises
license-invalid as critical (until 2026-08-24 this rule was license-expiring-soon, before it
merged with license-missing). That is expected on a new cluster, not a misconfiguration.
Warehouse detail — /clusters/{ns}/{name}/warehouses/{warehouse}
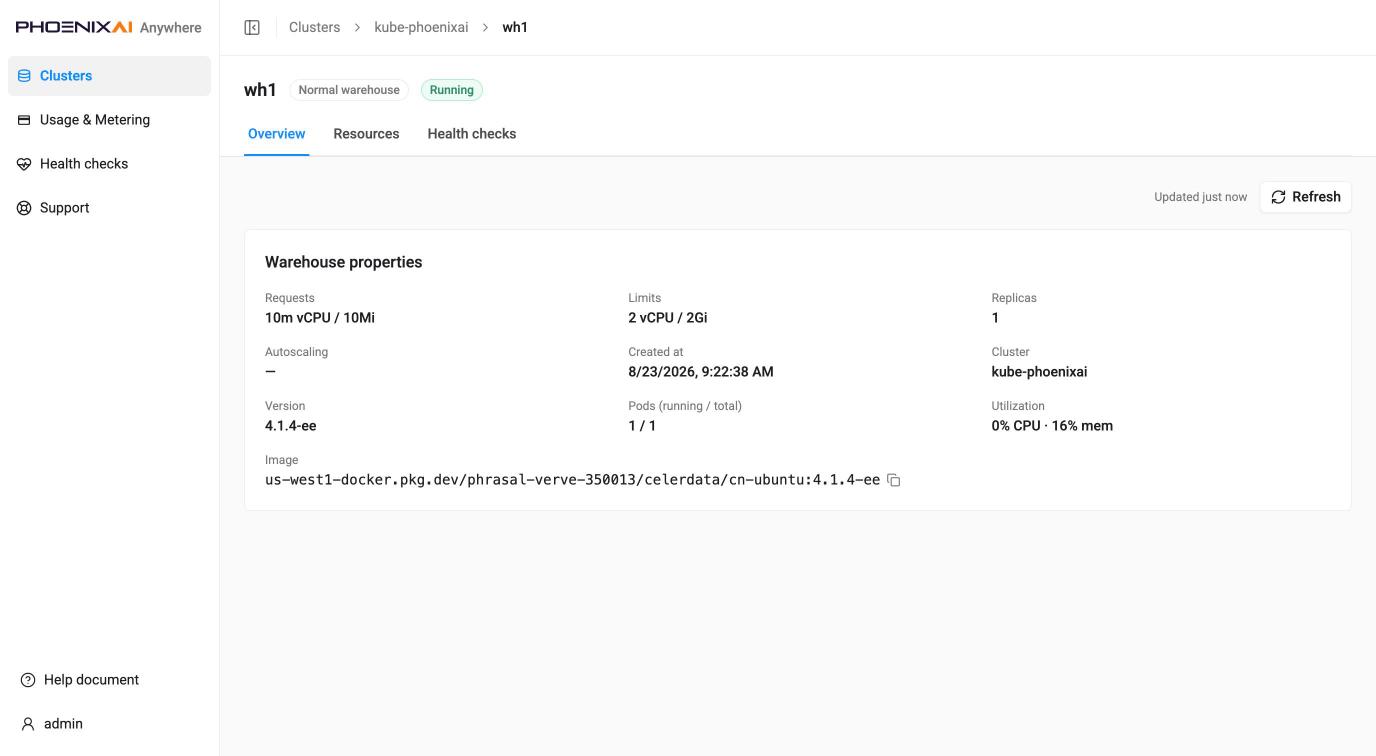
A warehouse as its own page rather than a dialog, so it is deep-linkable, with its own Overview, Resources and Health checks tabs. Overview carries requests and limits, replicas, autoscaling, created, cluster, version, pods, utilization and image.
Usage & Metering — /usage
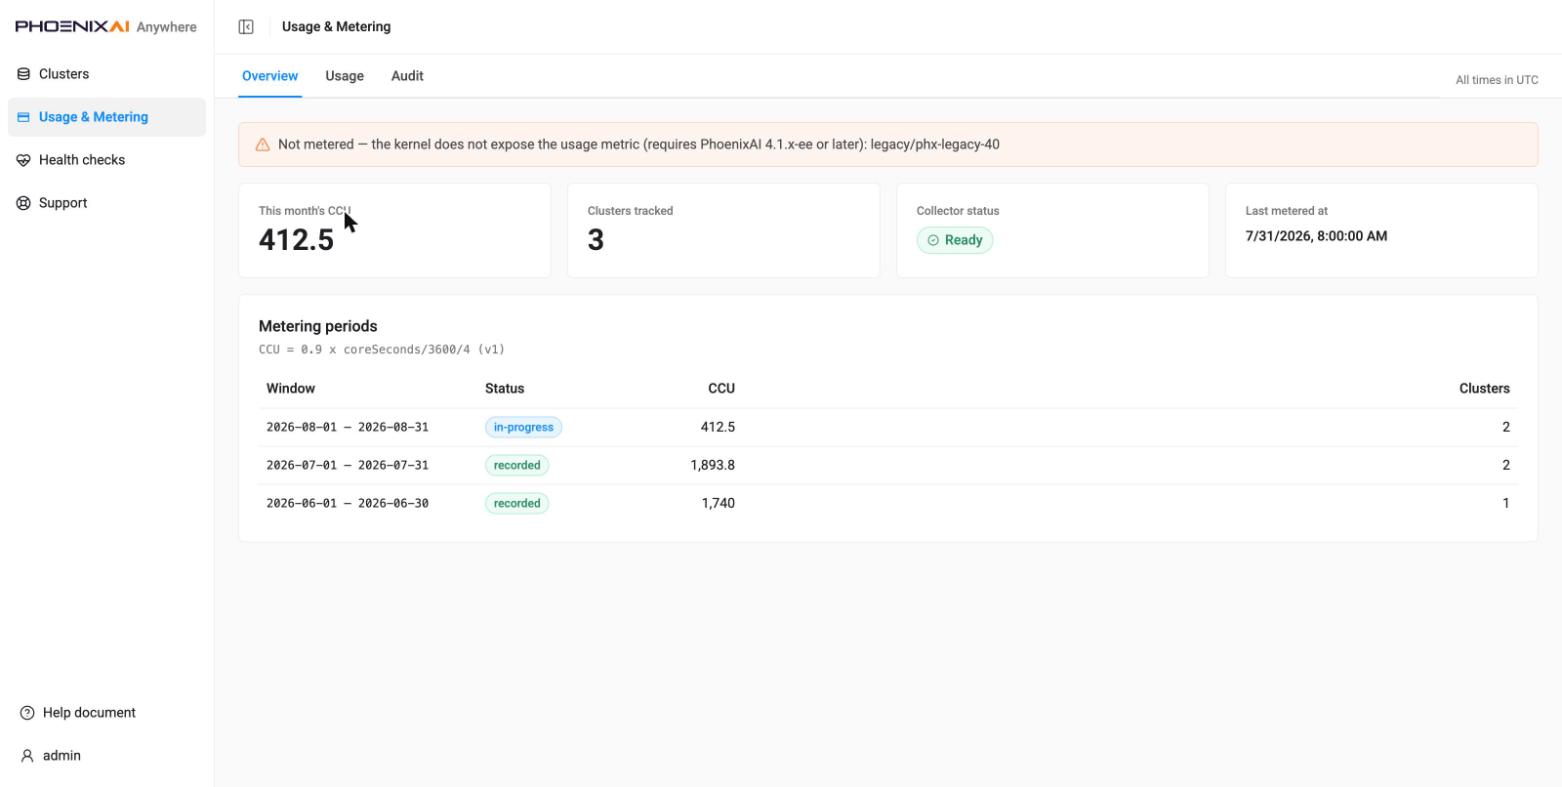
Install-level metering across all clusters, in three tabs. All times are UTC. Clusters running a PhoenixAI version that does not expose the usage metric are called out as not metered, with the required version stated, rather than shown as zero.
Overview — this month's CCU, clusters tracked, collector status, last metered at, and the
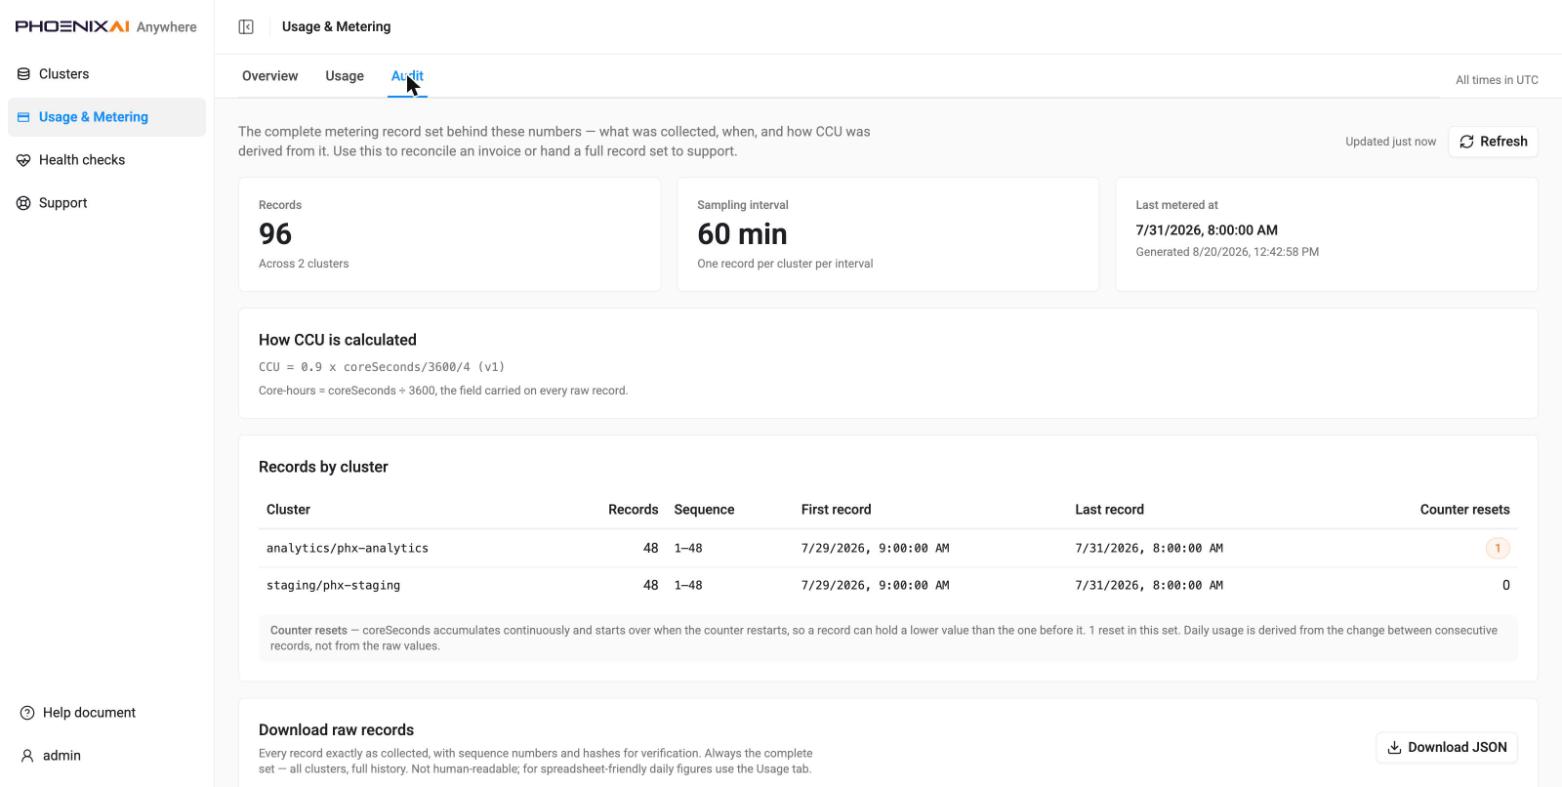
metering periods table with the CCU formula in force (CCU = 0.9 x coreSeconds/3600/4 (v1)).
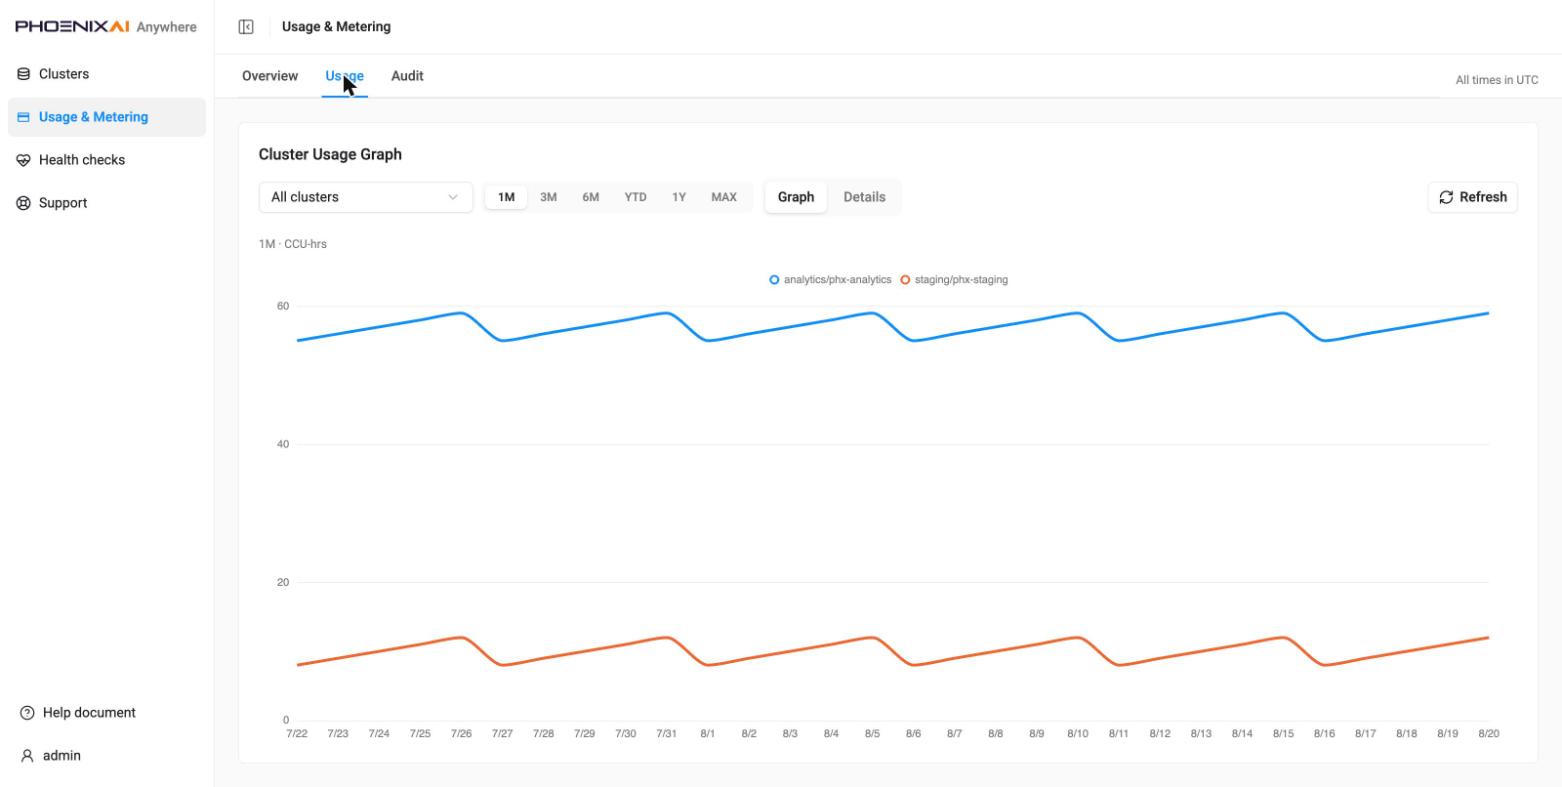
Usage — the cluster usage graph per day, filterable to one cluster or all, over 1M / 3M / 6M / YTD / 1Y / MAX, switchable between Graph and Details.
Audit — the complete record set behind those numbers: record count, sampling interval, how CCU is derived, per-cluster first/last record and sequence range, counter resets explained, and Download JSON of every raw record with sequence numbers and hashes for verification.
License — /license
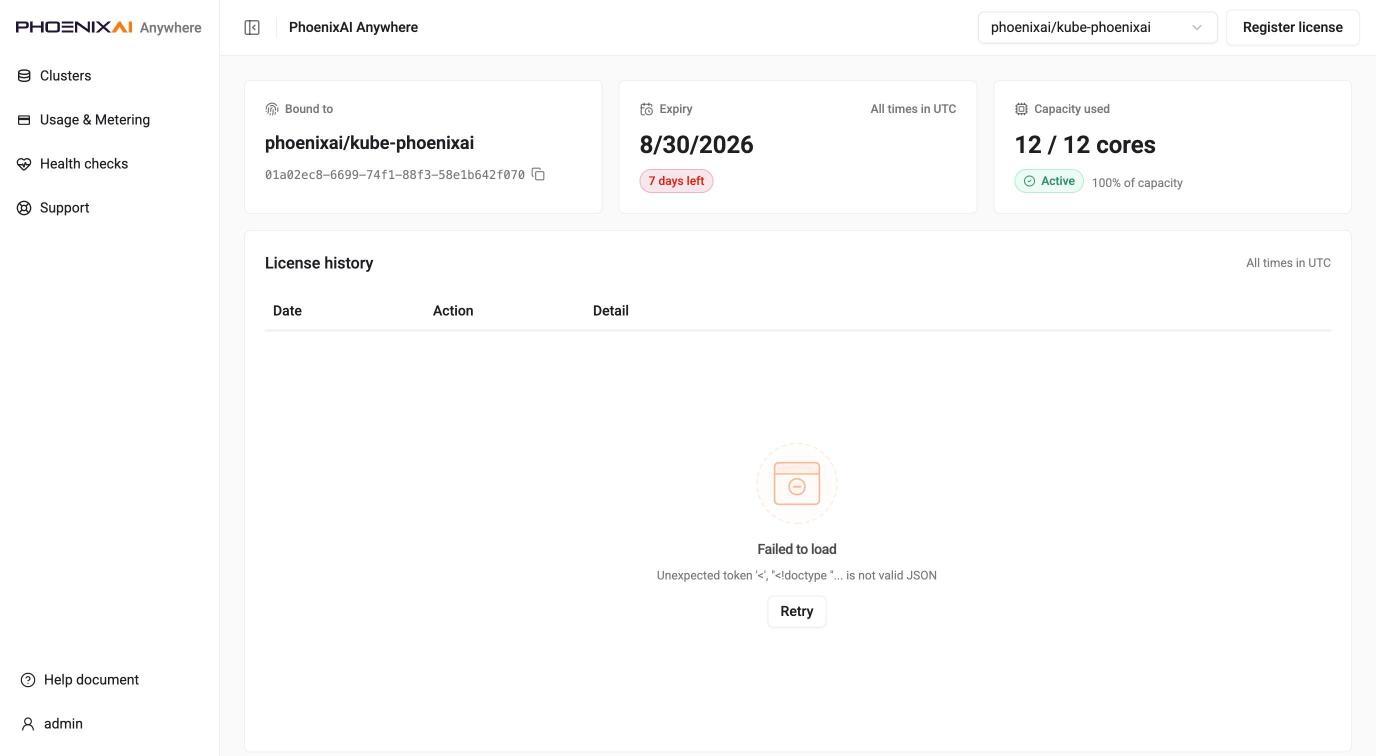
The install-level license page, with a cluster selector in the header (licenses are cluster-scoped) and Register license. Shows what the license is bound to, expiry with days remaining, and capacity used. Times are UTC.
The License history panel — activation, renewal and alert events — is served by an endpoint
the backend has not built yet (/api/v1/license/events, still marked a proposal in the
frontend's endpoint map). Against a real installation the request falls through to the SPA and the
panel reports Failed to load … is not valid JSON. The three summary cards above it are real.
Per-cluster license facts, including the registered-licenses table, are on the cluster's own License tab and do work.
Health checks — /health-checks
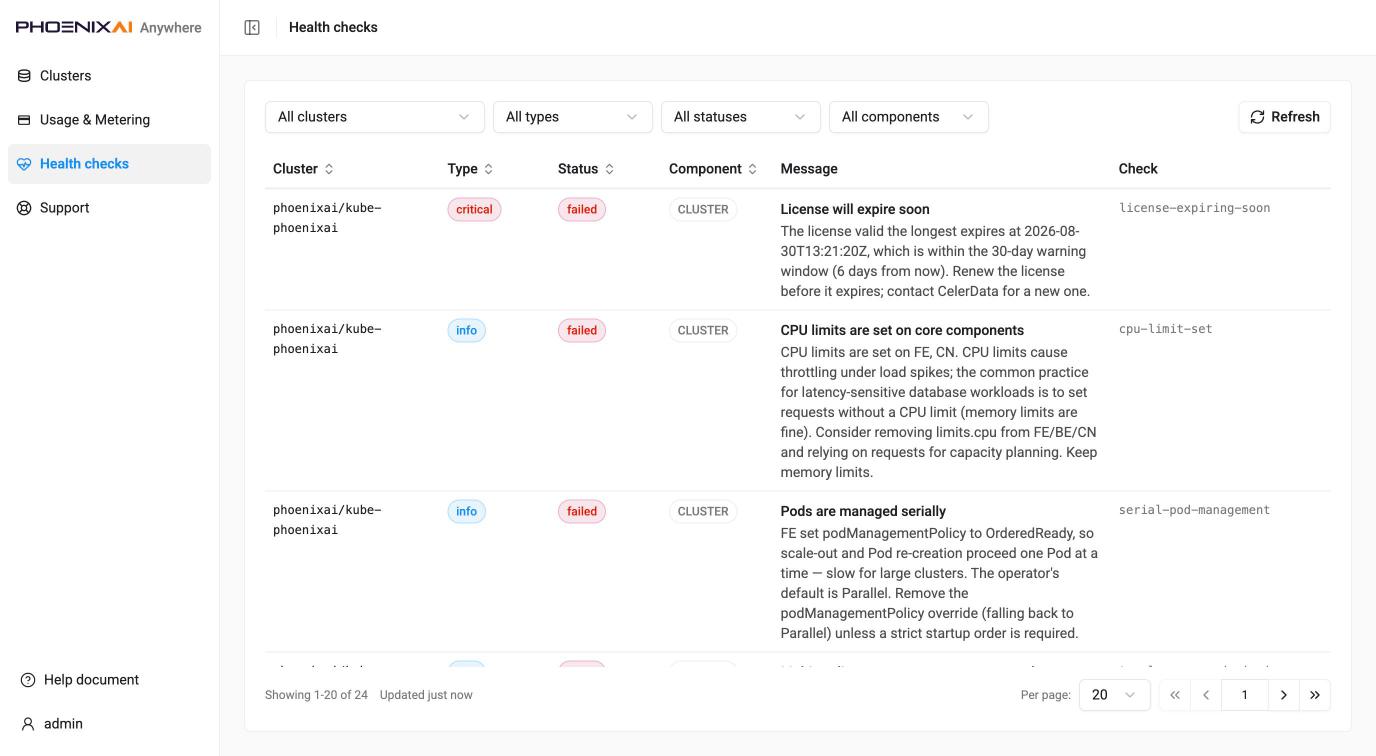
Every check across all clusters in one table — cluster, type, status, component, message and check id — filterable by cluster, type, status and component, with sortable columns and pagination. Findings are ordered by severity, then component, then rule id.
Support — /support
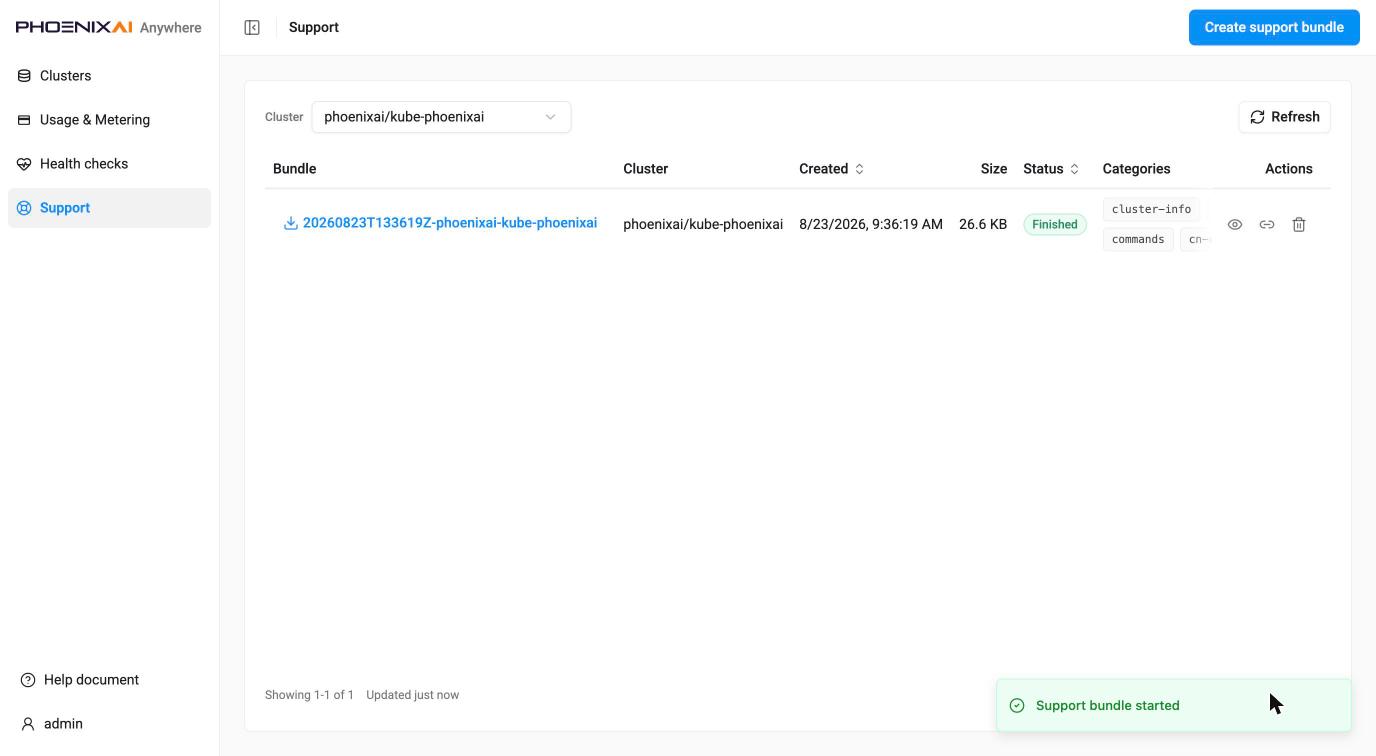
Support bundles for the selected cluster: bundle name, cluster, created, size, status and the categories collected. Finished bundles download from the name; the row actions view details, copy an export link, and delete. An Interrupted bundle (Anywhere restarted mid-run) offers resume instead. Sensitive values are excluded from bundles.
Create support bundle — /support/create
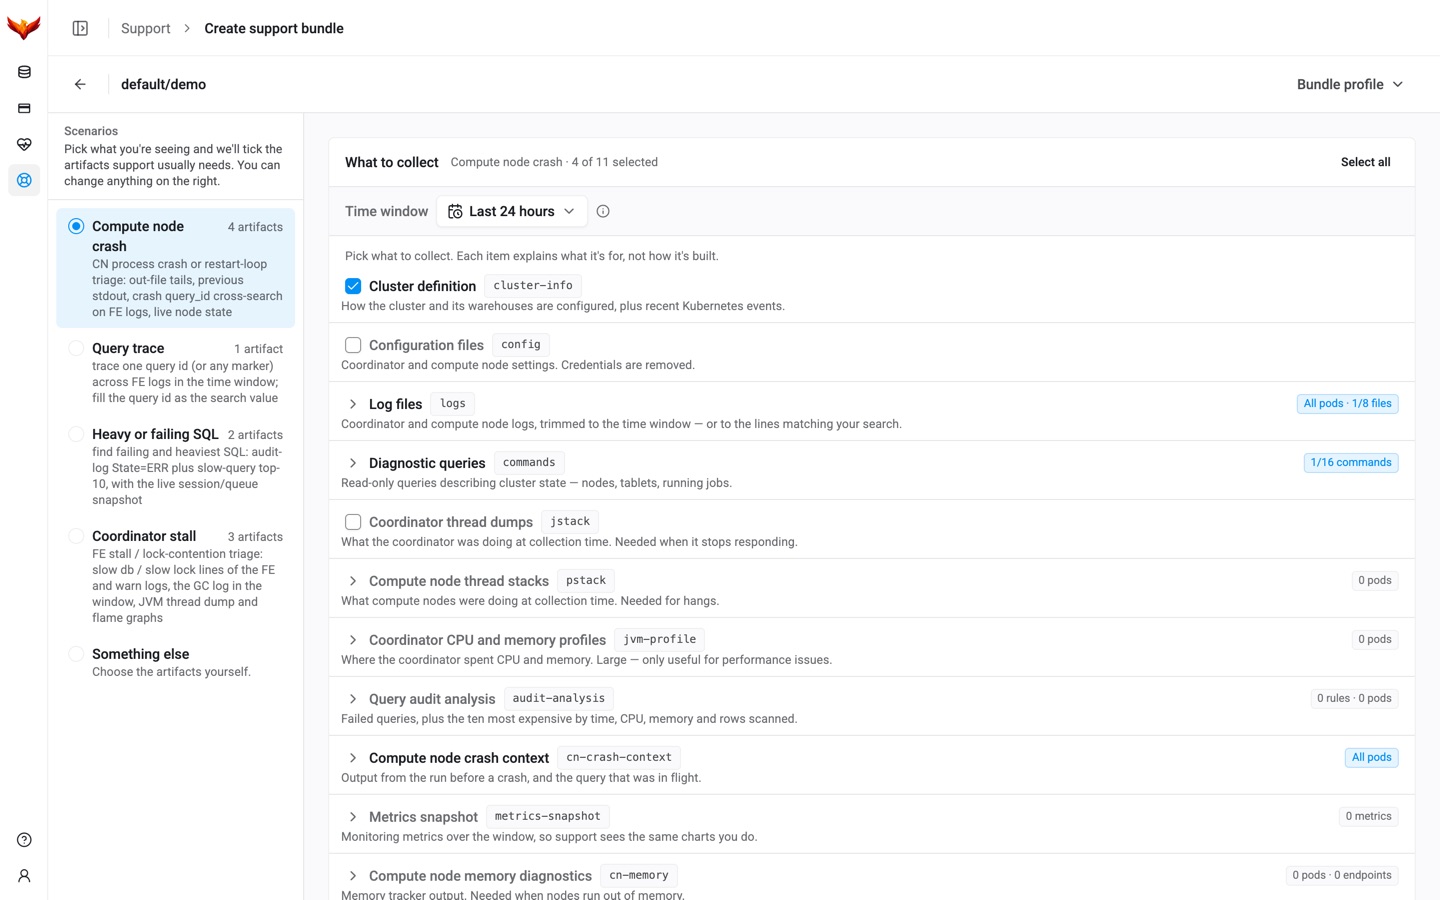
A full-page composer, which collapses the sidebar to icons. The Scenarios rail on the left
("pick what you're seeing and we'll tick the artifacts support usually needs") preselects a set —
compute node crash, query trace, heavy or failing SQL, coordinator stall — or Something else to
choose freely; each names how many artifacts it selects. On the right, What to collect lists
every artifact with what it is for, its collector id (cluster-info, config, logs,
commands, jstack, pstack, jvm-profile, audit-analysis, cn-crash-context,
metrics-snapshot, cn-memory), a shared time window, and per-artifact parameters. Log
collection can take whole files or only lines matching a search — the choice that decides whether
hundreds of megabytes or tens are transferred. The page warns when a selection is incomplete and
an artifact would be silently skipped.
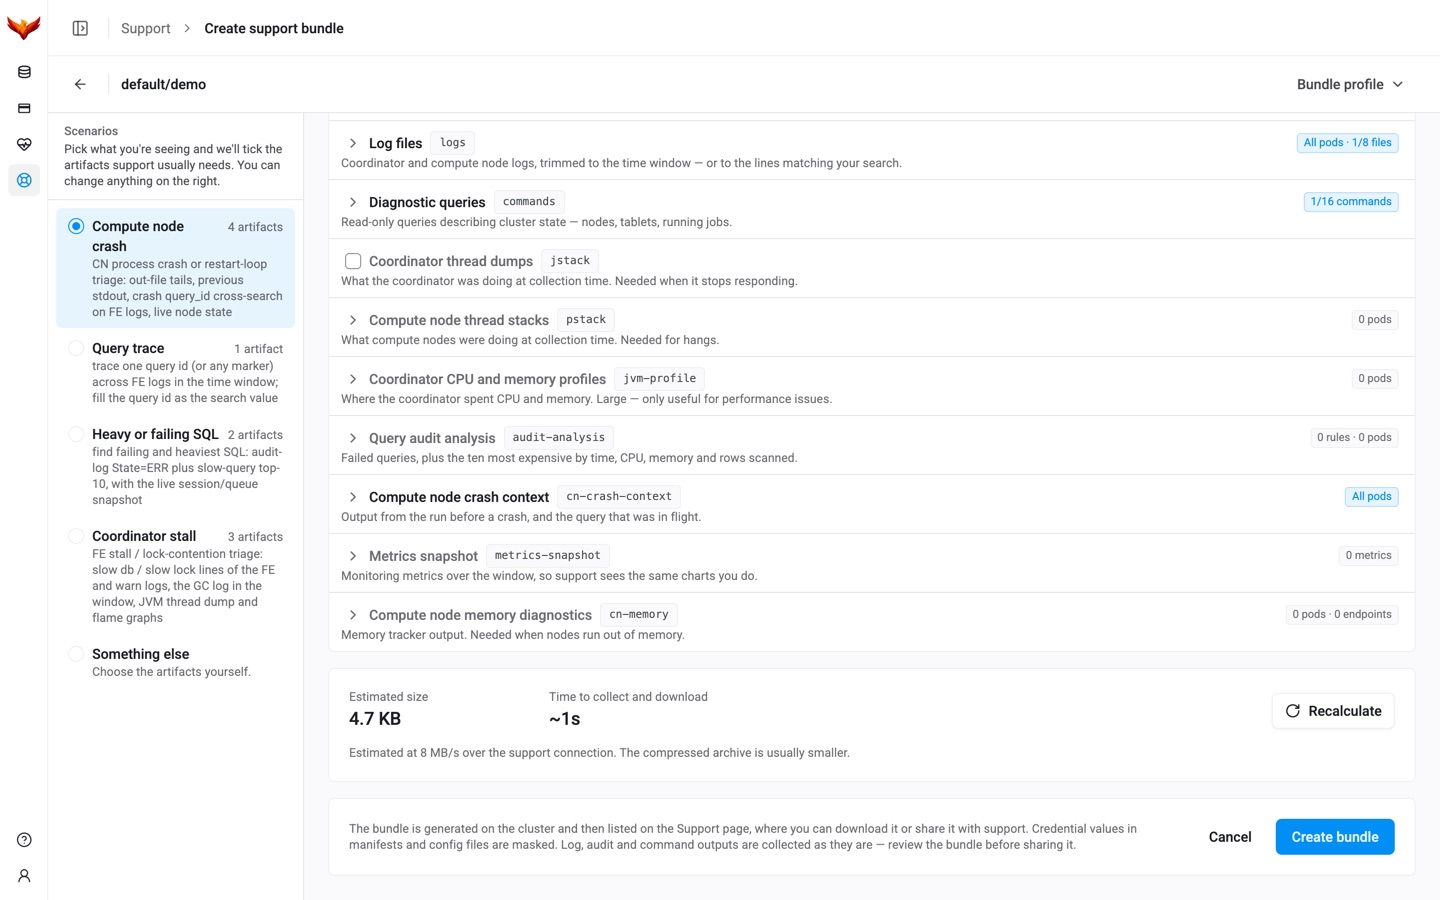
The footer carries an estimate — size and time to collect and download, with Recalculate — and one primary action, Create bundle. A large bundle asks for confirmation first.
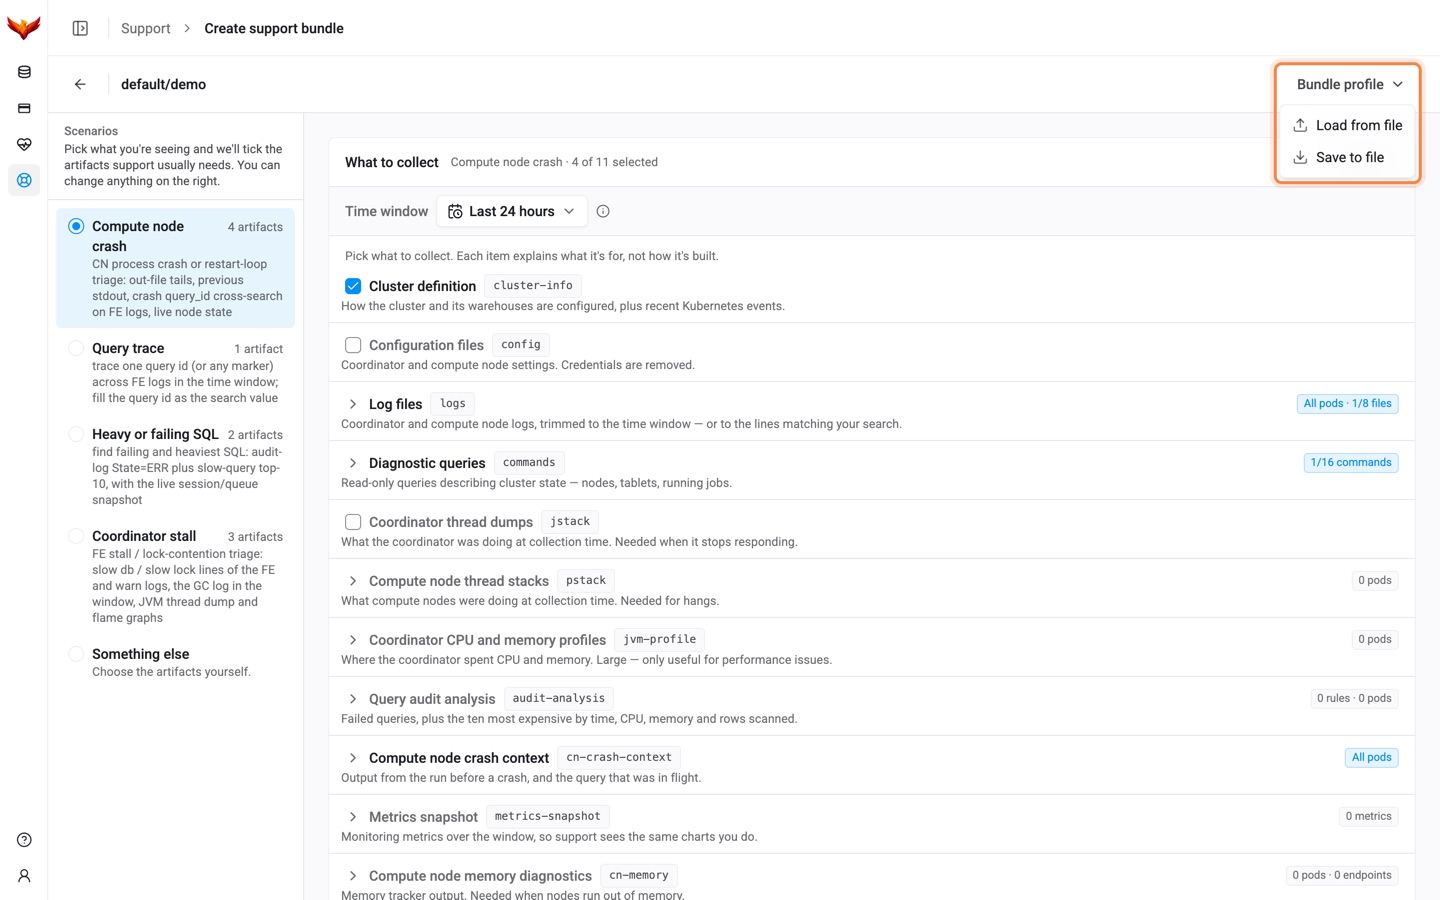
From v2.1, Bundle profile, at the right of the page header, on the row that names the cluster, saves the current selection to a file and loads one back. Save to file writes the artifacts, pods, time window and search values, with an optional note for whoever opens it, and no cluster name. Load from file opens a review step that reports what the file asks for that this cluster does not have before anything is applied; applying replaces the whole selection, and Create bundle is still a separate press. See Generating a support bundle.
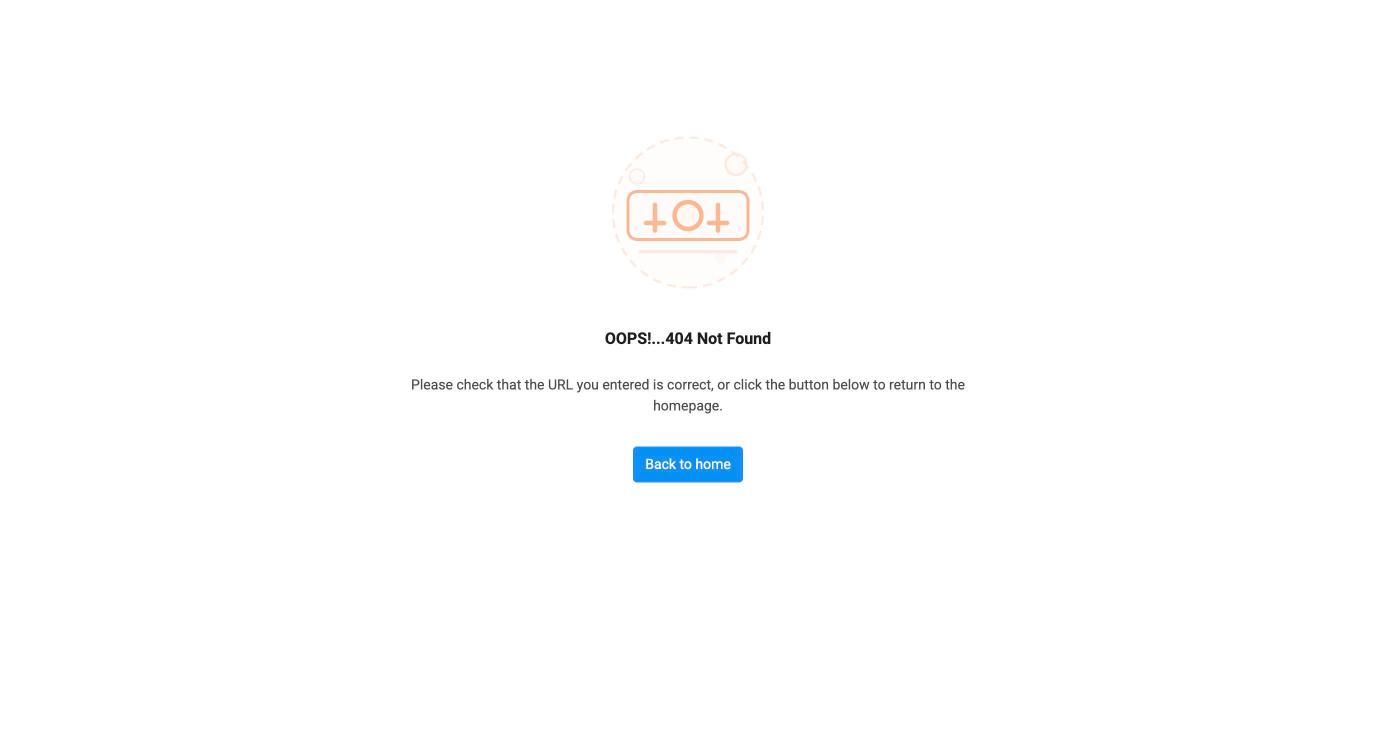
Not found — /404
A full-bleed error page with a link home. Unknown URLs resolve here without a session, so a typo or stale link never shows a sign-in page.